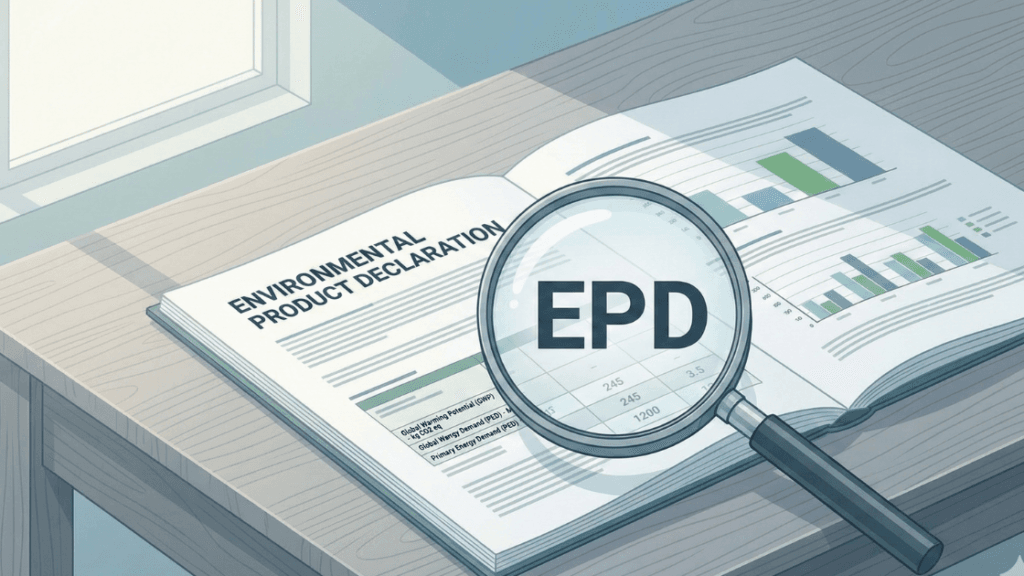
How to Read an EPD: A Practical Guide for Construction Professionals
Why EPDs Are Often Difficult to Understand
If you’ve ever opened an Environmental Product Declaration and felt overwhelmed, you’re not alone. EPDs are standardized technical documents that communicate complex environmental information in a consistent format. While this standardization ensures comparability, it can make EPDs appear intimidating to those unfamiliar with life cycle assessment methodology.
EPDs follow a predictable structure. Once you understand the key concepts and terminology, they become accessible. This guide will walk you through the essential elements you need to interpret EPD data confidently.
What an EPD Actually Tells You
An Environmental Product Declaration is an independently verified document that reports the environmental impacts of a product across its life cycle. Think of it as a nutrition label for building materials—it presents standardized environmental data based on life cycle assessment.
What EPDs can do:
- Provide transparent, comparable environmental data when products share the same category rules
- Support green building certifications and sustainable procurement decisions
- Help identify environmental hotspots in a product’s life cycle
- Enable informed comparisons between similar products
What EPDs cannot do:
- Tell you if a product is “good” or “bad” for the environment
- Serve as the sole basis for product selection
- Compare products across different categories without expert interpretation
- Replace other product quality or performance criteria
Critically, EPDs report environmental data, not product quality, safety, or fitness for purpose. A product with lower carbon emissions may not necessarily be the right choice for your project if it doesn’t meet performance requirements.
Key Terms You Must Understand Before Reading an EPD
Declared Unit vs Functional Unit
These two terms are fundamental to interpreting EPD results correctly.
The declared unit is the quantity of product for which environmental data is reported. This might be “1 kg of material,” “1 m² of board,” or “1 tonne of concrete.” The declared unit is always clearly stated at the beginning of an EPD.
The functional unit describes the product’s function over a reference period. For example: “1 m² of flooring, with a 25-year service life, capable of withstanding Class 33 commercial traffic.”
Why this matters: When comparing two flooring products, one might report impacts per square meter while another reports per kilogram. If Product A weighs twice as much as Product B per square meter, you need to adjust for this difference. Additionally, if one product lasts 25 years and another lasts 50 years, the long-term environmental performance differs significantly.
Always check the declared unit before interpreting or comparing EPD data.
System Boundary
The system boundary defines which life cycle stages are included in the assessment. Not all EPDs cover the same scope.
A complete system boundary might include raw material extraction, manufacturing, transportation, installation, use phase (maintenance, replacement, energy consumption), and end-of-life (demolition, waste processing, disposal). However, some EPDs cover only production (“cradle-to-gate”), while others include the full life cycle (“cradle-to-grave”).
Why this matters: When comparing products, ensure they have comparable system boundaries. A cradle-to-gate EPD cannot be directly compared with a cradle-to-grave EPD without careful analysis.
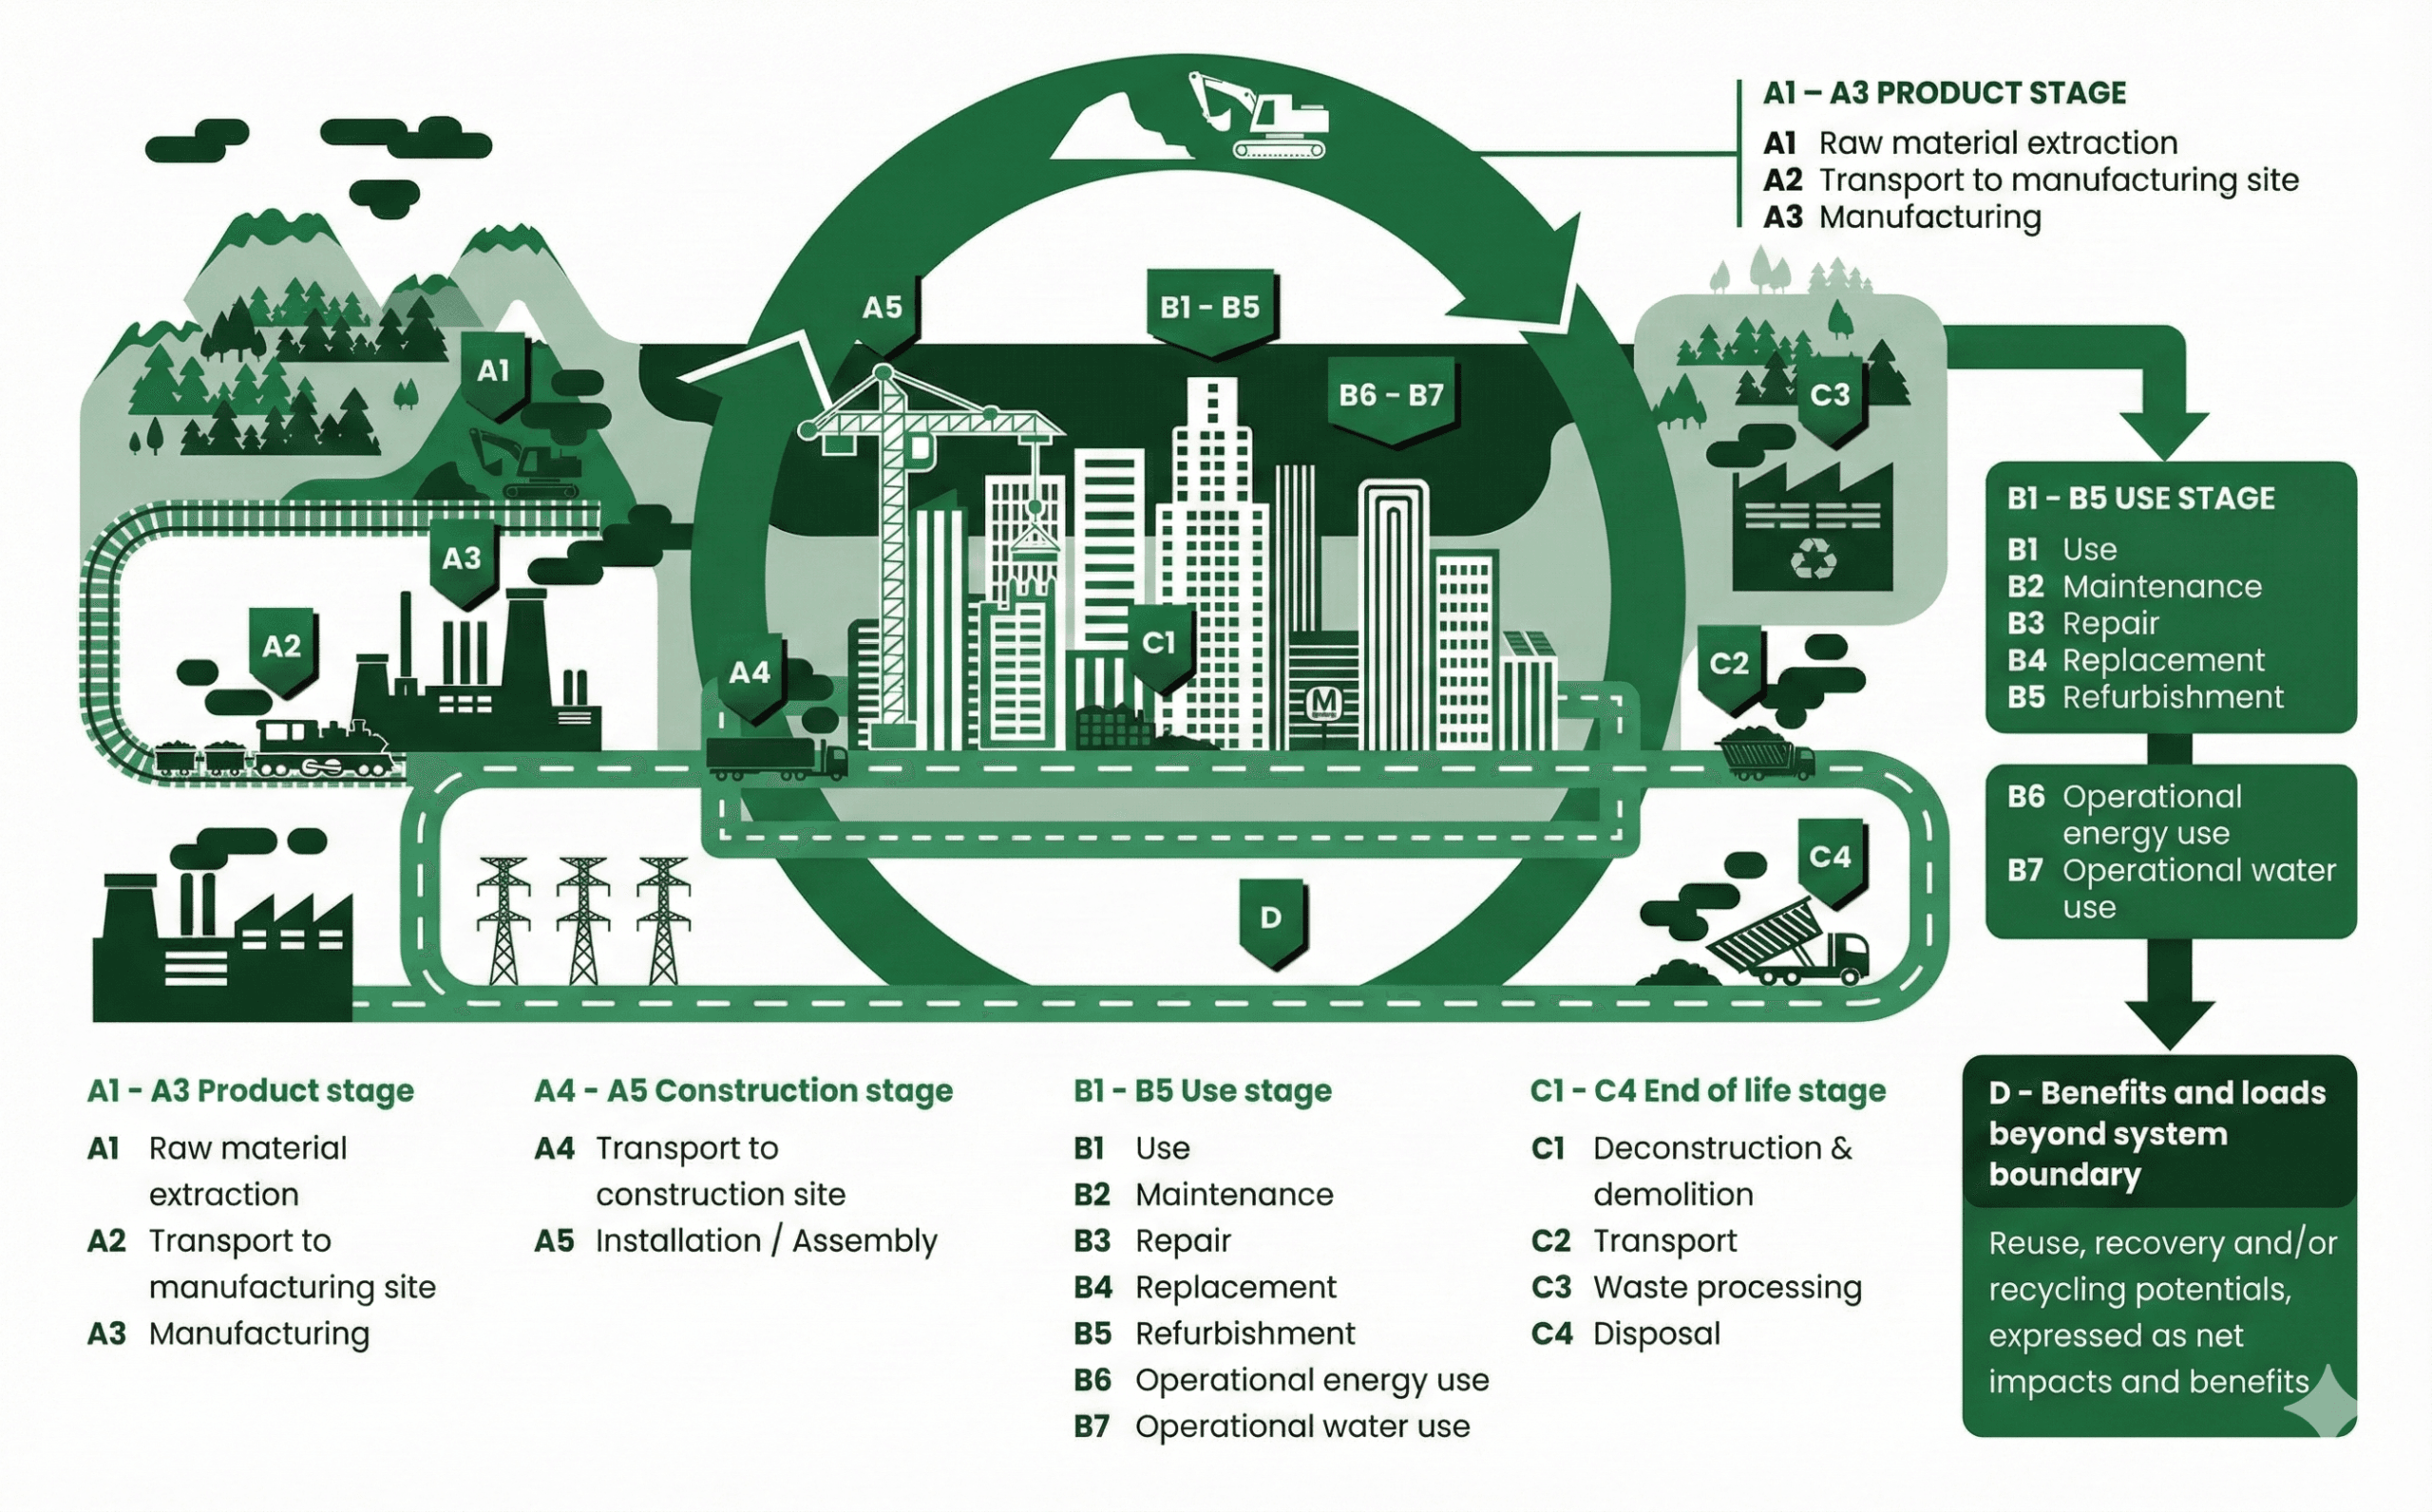
Life Cycle Modules (A1–D)
EPDs organize environmental data into standardized life cycle modules, typically following the EN 15804 structure:
A1–A3: Product Stage
- A1: Raw material extraction and processing
- A2: Transport to manufacturing facility
- A3: Manufacturing
This is the core production phase and is included in virtually all EPDs.
A4–A5: Construction Stage
- A4: Transport to construction site
- A5: Installation and construction waste
These modules depend on project-specific information and may show as “not declared” if generic scenarios aren’t provided.
B1–B7: Use Stage
- B1: Use
- B2: Maintenance
- B3: Repair
- B4: Replacement
- B5: Refurbishment
- B6: Operational energy use
- B7: Operational water use
Many products have minimal use-stage impacts, while others have significant impacts like windows affecting building energy performance.
C1–C4: End-of-Life Stage
- C1: Deconstruction/demolition
- C2: Transport to waste processing
- C3: Waste processing
- C4: Disposal
Module D: Benefits Beyond the System Boundary
This optional module shows potential environmental benefits from material recovery or recycling at end-of-life. Module D values are reported separately and can be negative, indicating environmental credits.
What zero or blank values mean: If a module shows zero or “not declared,” it doesn’t mean there’s no impact—it means the impact wasn’t calculated or isn’t relevant. For example, concrete EPDs might show zeros for modules B2–B5 because concrete typically requires no maintenance during the building’s life.
Why Module D can be negative: When materials are recycled and offset virgin material production elsewhere, this creates an environmental benefit reported as a negative value. This doesn’t reduce the product’s actual impacts but shows potential benefits if end-of-life assumptions are realized.
Understanding Common LCA Impact Categories in an EPD
EPDs report multiple environmental indicators:
- Global Warming Potential (GWP) measures greenhouse gas emissions in kg CO₂ equivalent. This is typically the most referenced indicator, but shouldn’t be the only factor in decision-making.
- Ozone Depletion Potential (ODP) measures substances that deplete the stratospheric ozone layer in kg CFC-11 equivalent. Values are often very low for modern products.
- Acidification Potential (AP) measures emissions contributing to acid rain in kg SO₂ equivalent, primarily from combustion processes.
- Eutrophication Potential (EP) measures nutrient enrichment in water bodies in kg PO₄ equivalent, often relating to agricultural inputs and certain manufacturing processes.
- Primary Energy Use is reported separately for renewable and non-renewable sources in megajoules (MJ), showing total energy demand across the product’s life cycle.
Why one indicator isn’t enough: A product with low carbon emissions might have high water consumption or resource depletion. Sustainable decision-making requires considering multiple indicators alongside performance, cost, and project requirements.
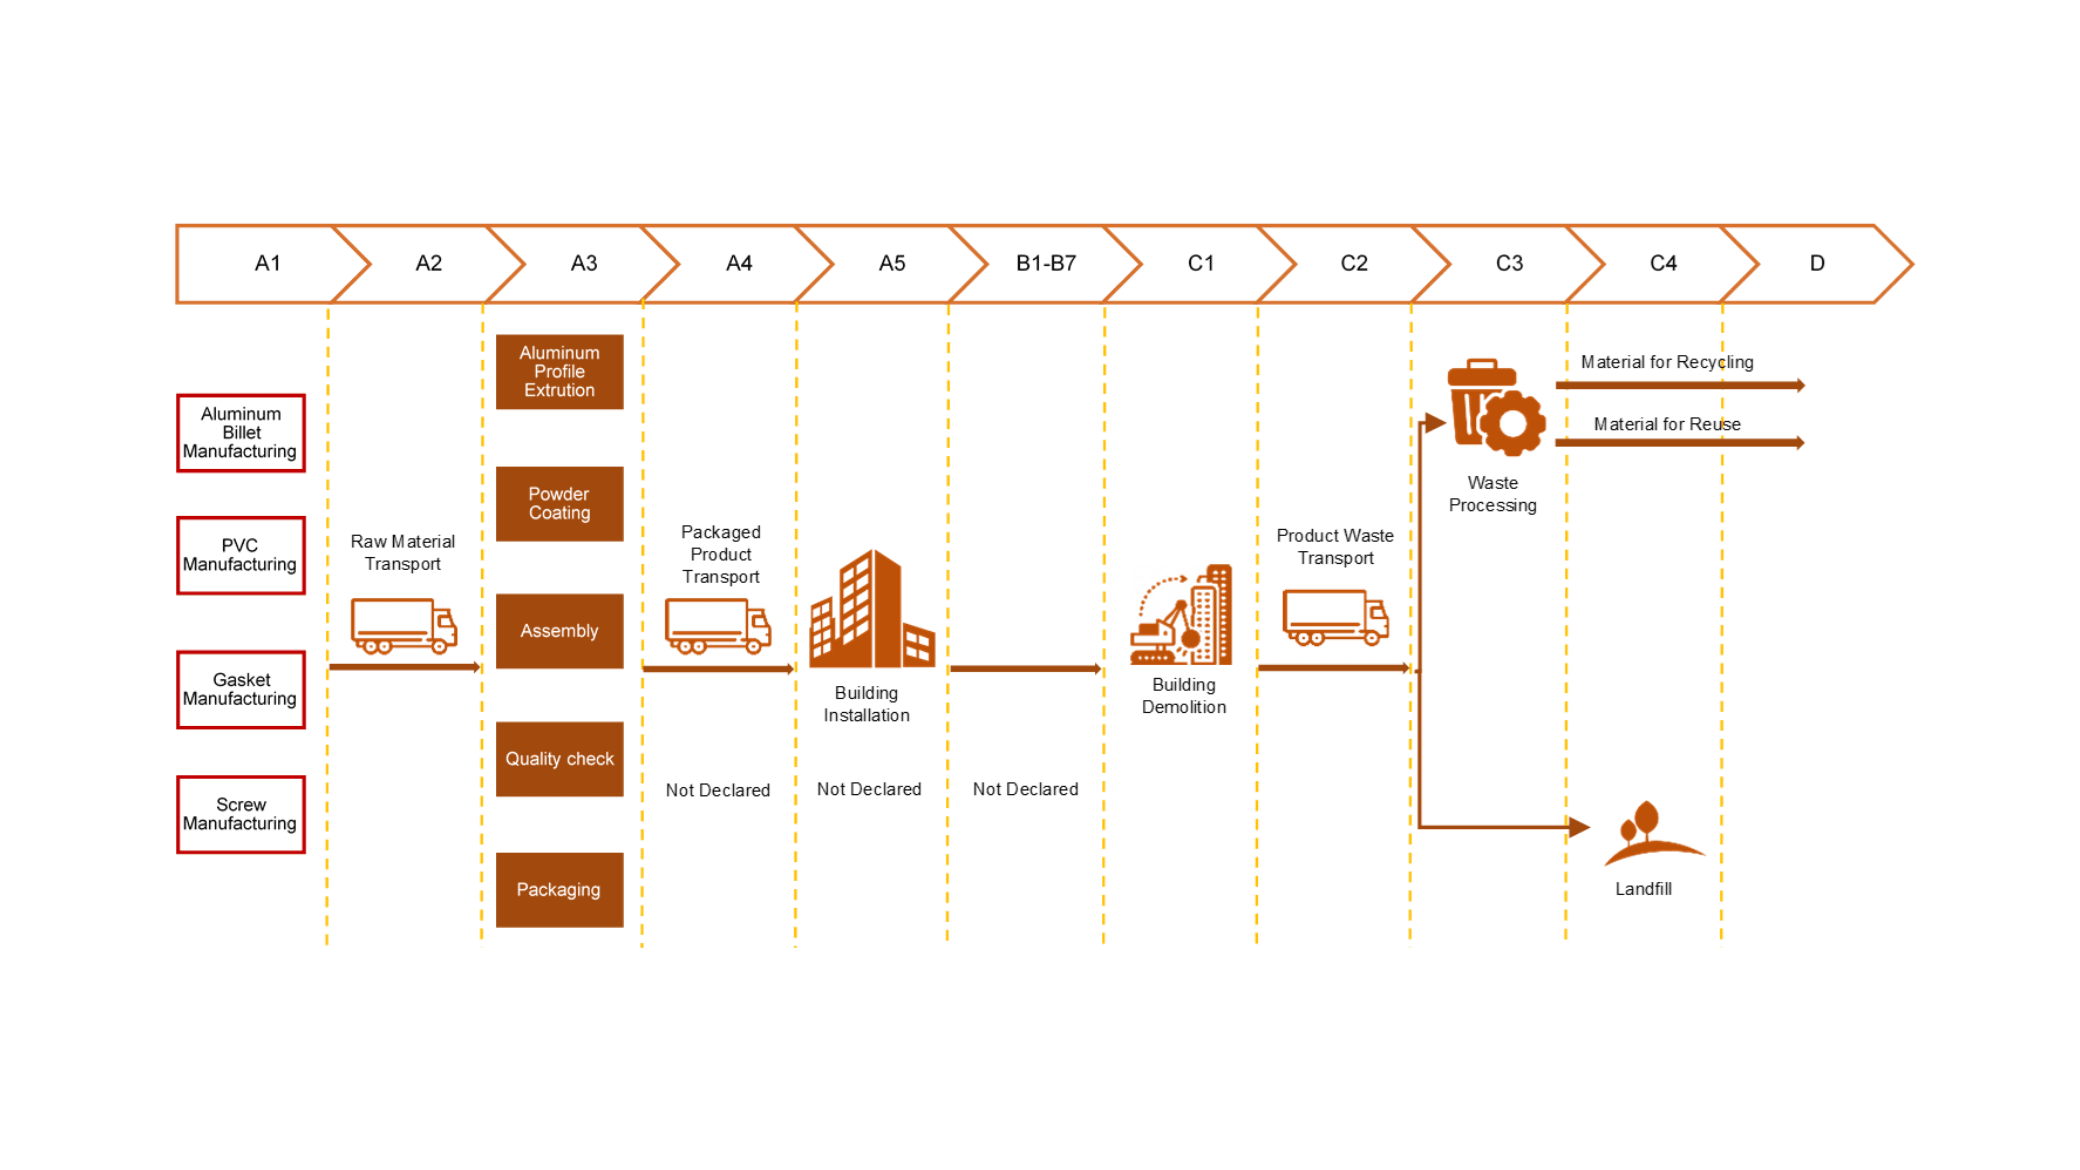
System diagram showing the life cycle stages of an aluminum frame Environmental Product Declaration (EPD) from A1 to D.
Understanding Common LCA Impact Categories in an EPD
EPDs report multiple environmental indicators:
- Global Warming Potential (GWP) measures greenhouse gas emissions in kg CO₂ equivalent. This is typically the most referenced indicator, but shouldn’t be the only factor in decision-making.
- Ozone Depletion Potential (ODP) measures substances that deplete the stratospheric ozone layer in kg CFC-11 equivalent. Values are often very low for modern products.
- Acidification Potential (AP) measures emissions contributing to acid rain in kg SO₂ equivalent, primarily from combustion processes.
- Eutrophication Potential (EP) measures nutrient enrichment in water bodies in kg PO₄ equivalent, often relating to agricultural inputs and certain manufacturing processes.
- Primary Energy Use is reported separately for renewable and non-renewable sources in megajoules (MJ), showing total energy demand across the product’s life cycle.
Why one indicator isn’t enough: A product with low carbon emissions might have high water consumption or resource depletion. Sustainable decision-making requires considering multiple indicators alongside performance, cost, and project requirements.
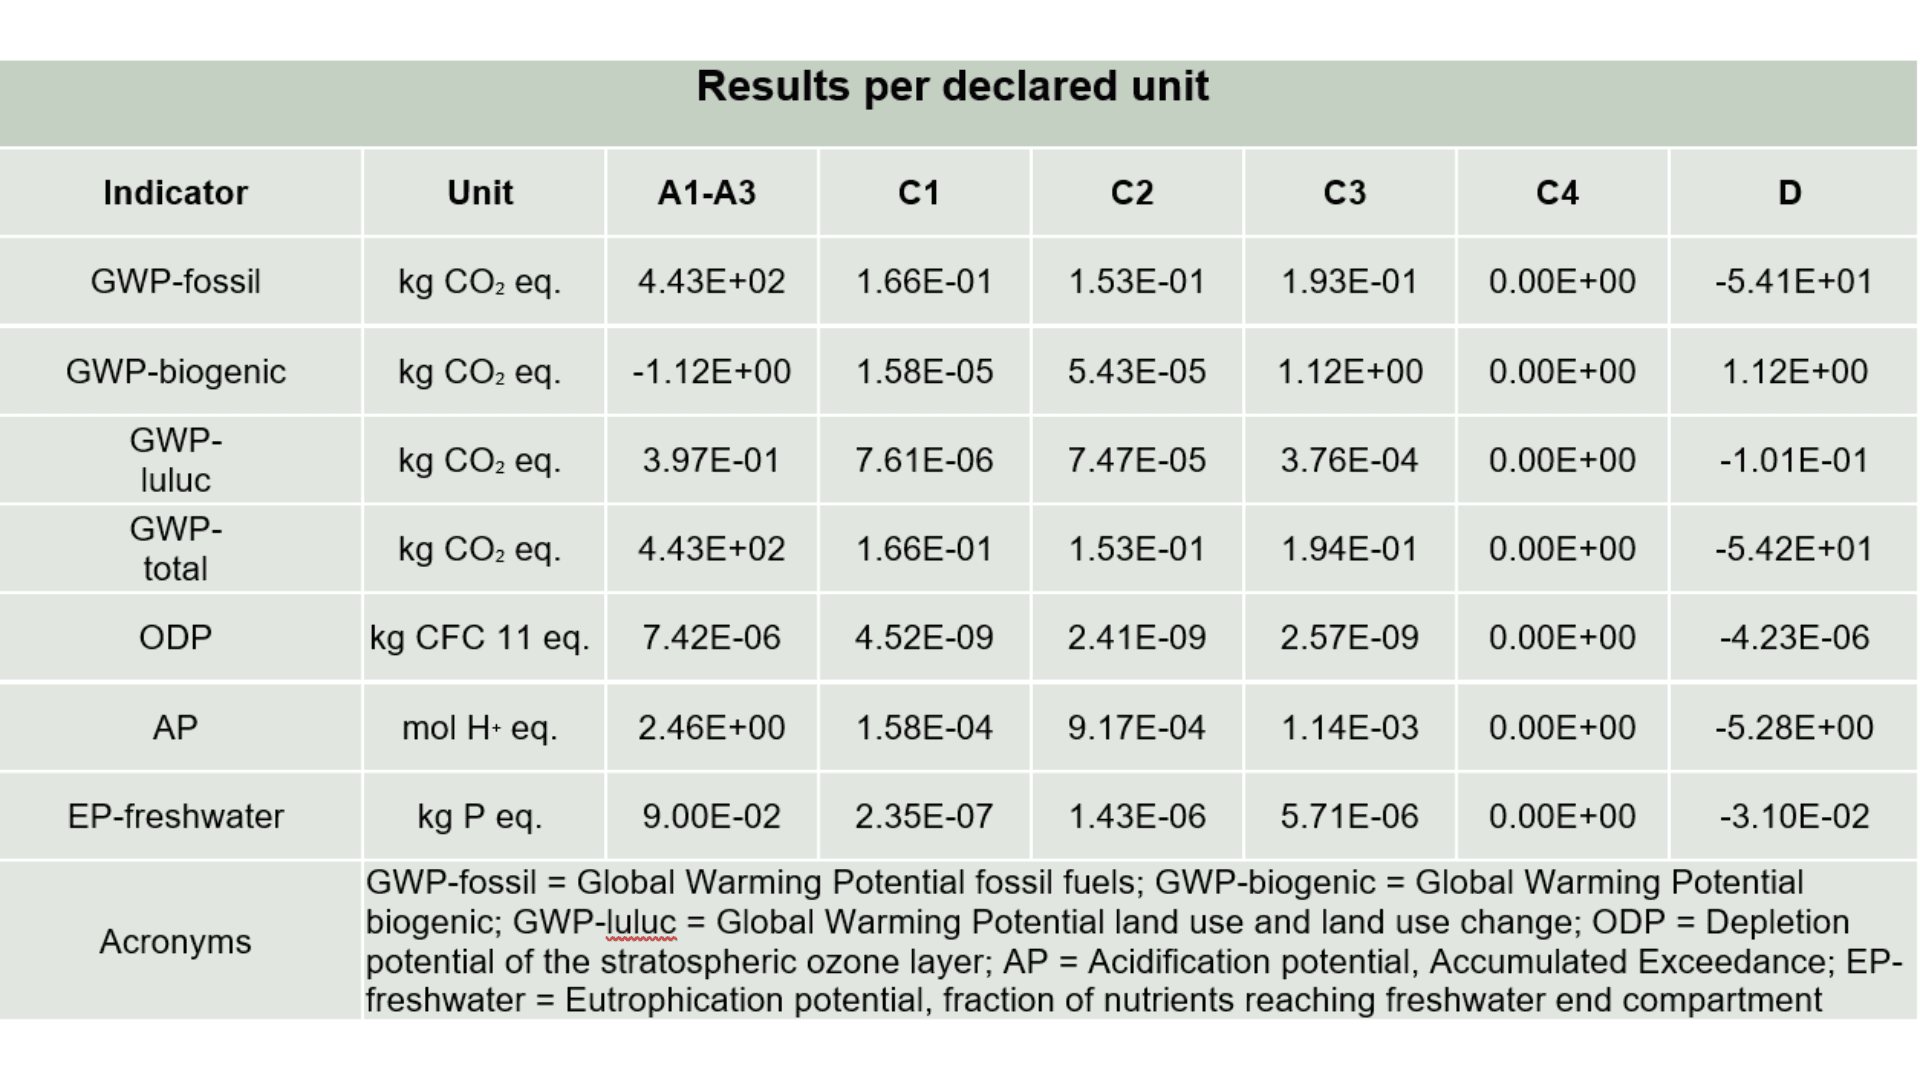
Example of a Life Cycle Assessment (LCA) results table from an Environmental Product Declaration (EPD), showing environmental impact indicators reported across different life cycle stages.
How to Read an EPD Results Table
EPD results are typically presented in a table with impact categories in rows and life cycle modules in columns. Here’s how to interpret it effectively:
Step 1: Identify the declared unit
Look at the top of the table. Understanding what quantity the numbers represent is essential before interpreting values.
Step 2: Check which modules are included
Scan the column headers. Are A1–A3 the only modules reported, or does the EPD include construction, use, and end-of-life? This tells you the assessment’s completeness.
Step 3: Look at the production stage first (A1–A3)
These modules are always included and form the baseline for understanding manufacturing footprint.
Step 4: Examine use-stage impacts (B1–B7)
If included, these can dominate for products requiring energy, maintenance, or replacement. A window with good thermal performance may have higher production impacts but lower overall impacts when operational energy savings are considered.
Step 5: Consider end-of-life and Module D
End-of-life impacts depend on assumed scenarios. Module D benefits are potential, not guaranteed, and depend on actual end-of-life practices.
What this number actually means: A GWP value of 250 kg CO₂e per declared unit means producing that quantity of product generates emissions equivalent to 250 kg of carbon dioxide. Whether this is high or low depends on the product category and functional performance.
A common misunderstanding: Higher numbers don’t automatically make a product “worse.” A thicker insulation might show higher production emissions but deliver greater lifetime energy savings. Context and functional performance are essential.
This does not mean the product is better or worse: EPDs provide data, not judgments. A product with lower GWP might have higher water use, shorter lifespan, or inferior performance. Environmental data must be weighed against all project requirements.
Common Mistakes When Reading or Using EPDs
Comparing EPDs with different declared units: Comparing “per kg” with “per m²” without conversion leads to meaningless conclusions.
Ignoring system boundaries: A cradle-to-gate EPD excludes significant life cycle impacts. Comparing it with a cradle-to-grave EPD creates false impressions.
Using EPD data outside its intended scope: EPDs are product- and facility-specific. Data may not represent products made in different regions.
Assuming lower GWP always means a better product: Climate impact is one of many considerations. Product performance and durability must guide decisions.
Ignoring data quality: Third-party verified EPDs following international standards are more reliable than self-declared claims.
Overlooking temporal validity: EPDs expire, typically after five years. Outdated EPDs may not reflect current practices.
Final Thoughts: Using EPDs Correctly
Environmental Product Declarations are powerful decision-support tools when used appropriately. They provide standardized, verified environmental data for material selection, green building certification, and supply chain improvement.
However, EPDs require context and interpretation. The numbers don’t dictate decisions—they inform decisions made with consideration of performance, cost, availability, and project requirements.
Key principles for using EPDs:
- Compare products within the same category with similar system boundaries
- Look beyond single indicators like carbon emissions
- Consider the full life cycle, not just production
- Verify EPDs are current and third-party verified
- Account for product performance and service life
When working on projects requiring EPD interpretation or green building certification, expert support ensures you’re using environmental data correctly.
EPDs are one piece of a broader sustainability strategy. With the framework in this guide, reading and interpreting EPDs becomes a manageable skill that enhances informed, environmentally conscious decisions in construction.
Free EPD Strategy Consultation
We offer complimentary 30-minute EPD strategy consultations for manufacturers across the KSA. During this consultation, we’ll assess whether EPDs make strategic sense for your products, identify applicable Programme Operators and Product Category Rules, discuss single product versus group EPD approaches, and provide realistic timeline and cost estimates.
Contact Planet First Consultants. We respond to all inquiries within one business day and help you determine how EPDs can strengthen your market position and open new business opportunities.
Get Free Consultation With Our Experts
- All Posts
- blog
- Cases
How Amazon Sellers Can Earn the Carbon Impact Badge — And Why a Product Carbon...

Why ISO Certificates Are the Fastest Way to Improve Your EcoVadis Score By Danushka Prabhad,...

UAE GHG Reporting: What Businesses Must Do Before the Deadline By Danushka Prabhad, Senior Sustainability...

GHG Reporting in Abu Dhabi: The Complete MRV Guide Under UAE Federal Law No. 11...

How EPDs, LCA, and FSC Certified Wood Help Achieve LEED and BREEAM Credits By Danushka...

How to Register Your Company on EcoVadis (Step-by-Step Guide) Learn how to register your company...

ISO 14019: What You Need to Know About the New Sustainability Verification Standard If you’ve...

How to Read an EPD: A Practical Guide for Construction Professionals Why EPDs Are Often...

Everything You Need to Know About EPDs: All Questions Answered Home Everything You Need to...

Case Study 2 Home How Planet First Helped a Market Intelligence Firm Improve Its EcoVadis...

EPD Program Operators: How to Choose, Credibility, and Global Overview If you’re a UAE business...

Why Companies Fail EcoVadis Before Scoring Even Starts: The 55-Document Trap You’ve gathered everything—environmental policies,...
Boost Your Sustainability Performance with Expert Help
Work with Planet First, the trusted Sustainbility consultants in the Middle East, and ensure your sustainability performance is fully recognized.
info@theplanetfirst.org
Phone
+971 50 25 35 594
A sustainability consultancy supporting ESG reporting, carbon footprint calculations, and compliance for businesses.
Main Services
Industry & Regional Services
Contact
- 112, Normandy 2, Al Nadha 2, Dubai, UAE
- info@theplanetfirst.org
- +971 50 253 5594